Featured post

GUEST POST: A Very Brief History of Optical High Resolution Satellite Imaging

The history of the optical high resolution satellite images starts from classified military satellite systems of the United States of America that captured earth’s surface from 1960 to 1972. All these images were declassified by Executive Order 12951 in 1995 and made publically available (Now freely available through the USGS EarthExplorer data platform under the category of declassified data). From 1999 onward, commercial multispectral and panchromatic datasets have been available for public. Launch of Keyhole Earthviewer in 2001, later renamed as Google Earth in 2005, opened a new avenue for the layman to visualize earth features through optical high resolution satellite images.

A comparison of declassified Corona (1974) vs. GeoEye-1 (2014) image. Image credits: EarthExplorer (Corona) and Google Earth (GeoEye-1).

In the current era, most high resolution satellite images are commercially available, and are being used as a substitute to aerial photographs. The launch of SPOT, IKONOS, QuickBird, OrbView, GeoEye, WorldView, KOMPSAT etc. offer data at fine resolutions in digital format to produce maps in much simpler, cost effective and efficient manner in terms of mathematical modeling. A number of meaningful products are being derived from high resolution datasets, e.g., extraction of high resolution Digital Elevation Models (DEMs) with 3D building models, detailed change assessments of land cover and land use, habitat suitability, biophysical parameters of trees, detailed assessments of pre and post-disaster conditions, among others.

Both aerial photographs and high resolution images are subject to weather conditions but satellites offer the advantage of repeatedly capturing same areas on a reliable basis by considering the user demand without being restricted by considering borders and logistics, as compared to aerial survey.

Pansharpening / resolution merge provides improved visualization and is also used for detecting certain features in a better manner. Pansharpening / resolution merge is a fusion process of co-georegistered panchromatic (high resolution) and multispectral (comparatively lower resolution) satellite data to produce high-resolution color multispectral image. In high resolution satellite data, the spectral resolution is being increased and more such sensors with enhanced spectral sensitivity are being planned in the future.

List of the Spaceborne Sensors with <5 m Spatial Resolution

Sensors Agency/Country Launch Date Platform altitude (km) GSD Pan/MSS (m) Pointing capability (o) Swath width at nadir (km)
IKONOS-2 GeoEye Inc./USA 1999 681 0.82/3.2 Free View 11.3
EROS A1 ImageSat Int./Cyprus (Israel) 2000 480 1.8 Free View 12.6
QuickBird DigitalGlobe/USA 2001 450 0.61/2.44 Pan and MSS alternative Free View 16.5
HRS SPOT Image/France 2002 830 5X10 Forward/left +20/-20 120
HRG SPOT Image/France 2002 830 5(2.5)x10 sideways up to ±27 60
OrbViw-3 GeoEye Inc./USA 2003 470 1/4 Free View 8
FORMOSAT 2 NSPO/China, Taiwan 2004 890 2/8 Free View 24
PAN (Cartosat-1) ISRO/India 2005 613 2.5 Forward/aft 26/5 Free view to side up to 23 27
TopSat Telescope BNSC/UK 2005 686 2.8/5.6 Free View 15/10
PRISM JAXA/Japan 2005 699 2.5 Forward/Nadir/aft -24/0/+24 Free view to side 70 35 (Triplet stereo observations
PAN(BJ-1) NRSCC (CAST)/China 2005 686 4/32 Free View 24/640
EROS B ImageSat Int./Cyprus (Israel) 2006 508 0.7/- Free View 7
Geoton-L1Resurs-DK1 Roscosmos/Russia 2006 330-585 1/3 for h = 330km Free View 30 for h = 330km
KOMPSAT-2 KARI/South Korea 2006 685 1/4 sideways up to ±30 15 km
CBERS-2B CNSA/INPE China/Brazil 2007 778 2.4/20 Free View 27/113
WorldView-1 DigitalGlobe/USA 2007 494 0.45/- Free View 17.6
THEOS GISTDA/Thailand 2008 822 2/15 Free View 22/90
AlSat-2 Algeria 2008 680 2.5 up to 30 cross track Free view 17.5
GeoEye-1 GeoEye Inc./USA 2008 681 0.41/1.65 Free View 15.2
WorldView-2 DigitalGlobe/USA 2009 770 0.45/1.8 Free View 16.4
PAN (Cartosat-2, 2A, 2B) ISRO/India Cartosat 2-2007 Cartosat 2A-2008 Cartosat   2B-2010 631 0.82/- Free View 9.6
KOMPSAT-3 KARI/South Korea 2012 685 0.7/2.8 ±45º into any direction (cross-track or along-track) 15
WorldView-3 DigitalGlobe/USA 2014 617 0.3/1.24/3.7/30 13.1

 Conflicts of Interest: The findings reported stand as scientific study and observations of the author and do not necessarily reflect as the views of author’s organizations.

 About this post: This is a guest post by Hammad Gilani. Learn more about this blog’s authors here

What does “open-source software” actually mean?

The following MIT Technology Review article on the future of open source was a very interesting read for me yesterday. It explained many concepts I was not fully aware of, the history and parallel lines of open-source software development, and current and future challenges. One very interesting concept was the TTOSA (Time Till Open Source Alternative), representing the time between the release of a proprietary product and when an open-source equivalent becomes available.

Read the MIT Technology Review article here:

https://www.technologyreview.com/2023/08/17/1077498/future-open-source/

The exact choice of a Task Management Tool is not so important

This is something that has been brewing in my mind for the past few months. There are many many task management tools out there, and some market themselves exclusively now on smartphones. I started looking for task management tools when I was doing my PhD, and I distinctly remember that a seminar came up in the university library on this topic, and I went there, where they introduced a couple of tools. I now forget the other tool, but the tool which I picked up was to use was Trello, which I then used extensively during the PhD to manage various projects and tasks. For example, I remember I had a specific board for one of the scientific articles I was writing.

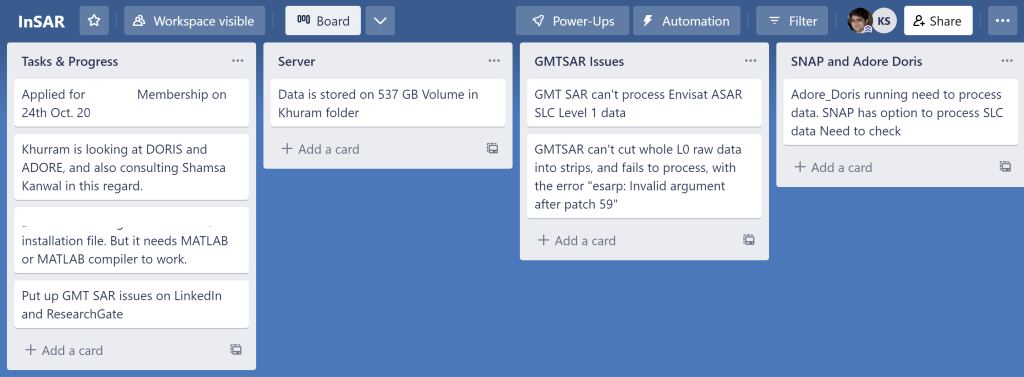
An example Trello board on a Masters research study I was supervising on an application of satellite-based InSAR (Interferometric Synthetic Aperture Radar).

Trello was of great help to me in managing my tasks and time, and I could follow my own progress, and not forget critical things. I carried over Trello into my academic career as well, and also for planning small projects + information organization in my personal life, e.g. travel, car buying etc., for which I still use it.

Since then, over the years, I have used many task management tools, such as: Asana, TickTick, Wrike, Microsoft Teams Lists. These multiple choices have been primarily driven by the tool in use or proposed by the organization I was working with. One of the new players on the block, with very heavy advertising, which I have not used, is Monday.com

So, with all this experience over the years, I can say this with confidence: The exact specific choice of a task management tool does not matter! You cannot find everything in one tool, every single one of them has 1-2 things missing. None of them is perfect, and yet all of them are perfect. The most important thing is to commit to one, and then work your way through it, and also to use it according to your requirements. If it is to be used by a team, then getting buy-in from the team is very important, because a task management system for a team only works when everyone is on board and using it every day.

Leadership and the Burden of Decision

I am back to writing on this blog after a while. Last year or so has been a year of big professional shifts for me, where I left the academic world after many years of post-PhD career and jumped fully into the deep waters of the commercial industry.

The journey has been challenging, exhilarating, exciting, and humbling all at the same time. So many things learnt, handled, solved, so many wins, and yet some punches taken as well.

As the leader of a technical team with various skill-sets, I have found that one of the most important characteristics that a leader should possess and / or develop is decision-making. Often there are situations when a decision has to be made, one way or the other; you may have just 5 minutes, and you need to make a decision to propel things forward, and to keep your team at peace and let them unleash on their own work, without worrying about decisions. Not making a decision is not an option. This I think of as the “burden of decision.” The word burden not used in a strictly negative sense, but more as a responsibility to be carried on the leader’s shoulders. A leader has to stand up, take decisions, often with incomplete information, and then take responsibility for them on his / her shoulders.

When I finished writing the thoughts above, I was curious to go on Google and search with the keywords above. Many articles talking about the same issue came up, but in my quick look at the top 3, I found this one very good: The Burden of Leadership

I am sure I will learn more about being a leader in the coming year, and looking forward to it.

Scientific Programming – Ten computer codes that transformed science

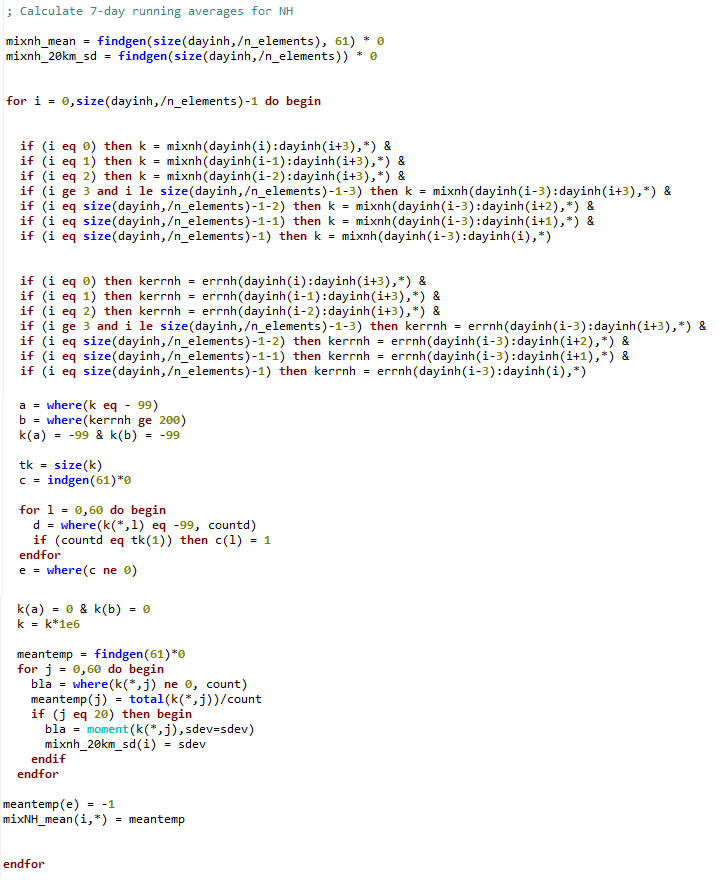
A just-published news feature in Nature talks about major computational developments in terms of code and platforms that impacted science. The article uses the term “scientist-coder”, and I use the synonym “scientific programmer” in my own professional communication. Scientific programming is one of the skills I have used extensively in my domain of work, and I see the need for it growing even further in the future. In fact, as I explain to my students in the domain of EO (Earth Observation) data processing / analysis, while you can accomplish lot of things with GUI-based softwares, they do have a limit, a “techincal ceiling”; and if you know scientific programming, you can break that ceiling, and the possibilities of what you can accomplish with the data become nearly endless.

An example of scientific programming in IDL

Out of the items listed in the article, I have learnt, used, and benefitted from the following or their derivatives in my academic / professional career:

  • FORTRAN
  • FFT
  • Metocean forecast models
  • BLAS
  • iPython / Jupiter

It is interesting to note that nearly all of the items which are not related to biological sciences have had an impact on my career in one way or another, which attests to their significance.

Let me know in the comments which of these codes / platforms have had an impact on your academic / professional career.

Pakistan Government Announces Scientific Study of Carbon Sequesteration Potential of Coastal Zone and Ocean

Recently I read a news article in DAWN regarding the plan of Pakistan government to conduct a study, in association with the World Bank, on the carbon sequestration potential of the country’s ocean waters and coastal mangrove forests.

It is great to read that there is a focus in Pakistan now on the potential of ocean waters for carbon storage, and blue carbon, which are both important carbon sinks in addition to terrestrial forests. The term “blue carbon” was coined barely a decade ago representing “organic carbon that is captured and stored by the oceans and coastal ecosystems, particularly by vegetated coastal ecosystems: seagrass meadows, tidal marshes, and mangrove forests.”

At the Geospatial Research & Education Lab (GREL), we have conducted and published research on terrestrial forest biomass and carbon storage potential in Pakistan (see, for example, our papers in the study areas of Chichawatni Irrigated Plantation and Murree Forest Division, and a blog post on Mapping and Monitoring of Pakistan’s Forests at the National Scale). Researchers at GREL also recognize the importance of Blue Carbon, especially the coastal Mangrove ecosystems, and a recent paper reports spatio-temporal analysis of Mangrove forests over two decades. Now, an ongoing research explores the role of soil in carbon sequestration in the coastal Mangrove ecosystems.

New InSAR Terminology Coming in Vogue: Master / Slave to Reference / Secondary

When teaching InSAR (Interferometric Synthetic Aperture Radar), it is always a kind-of-fun moment in class to answer student questions about why the terms “master” and “slave” are used for the two complex images in an InSAR pair. I have sometimes wished myself that a more scientific kind of terminology could be used for this.

Now, NASA’s open-source InSAR Scientific Computing Environment v2 (ISCE2) has implemented in the software the new InSAR scientific terminology of “reference” and “secondary” in place of “master” and “slave”, respectively, for the InSAR pair, to replace oppresive terminology. I think this will also make it easier and less awkward to explain to students the fundamental concepts of InSAR. The exact information about the latest 2.4.0 release of ISCE can be seen here.

This is probably the result of discussions within the scientific community since some time. See, for example, this joint statement by the COMET centre and WInSAR regarding the InSAR terminology in historical and contemporary use.

The Importance of Good Plots and Graphs: The McKinsey COVID-19 Briefing Note

I was recently looking at the McKinsey COVID-19 Briefing Note from late-March, and the first thought that come to my mind was that it is a great example of how to use clever and focussed graphs and plots to present data and information. In my personal view, choosing and implementing appropriate methods and approaches to visually present data is a skill that should be first learned, and then later on becomes an instinct with experience. I try to teach various methods of plotting and representing information in my graduate course on Data Analysis for the Earth Sciences, and whenever I teach it next, I think I will definitely use the McKinsey report as a case study / example. Access the McKinsey late-March COVID-19 Briefing Note here and take a look for yourself.

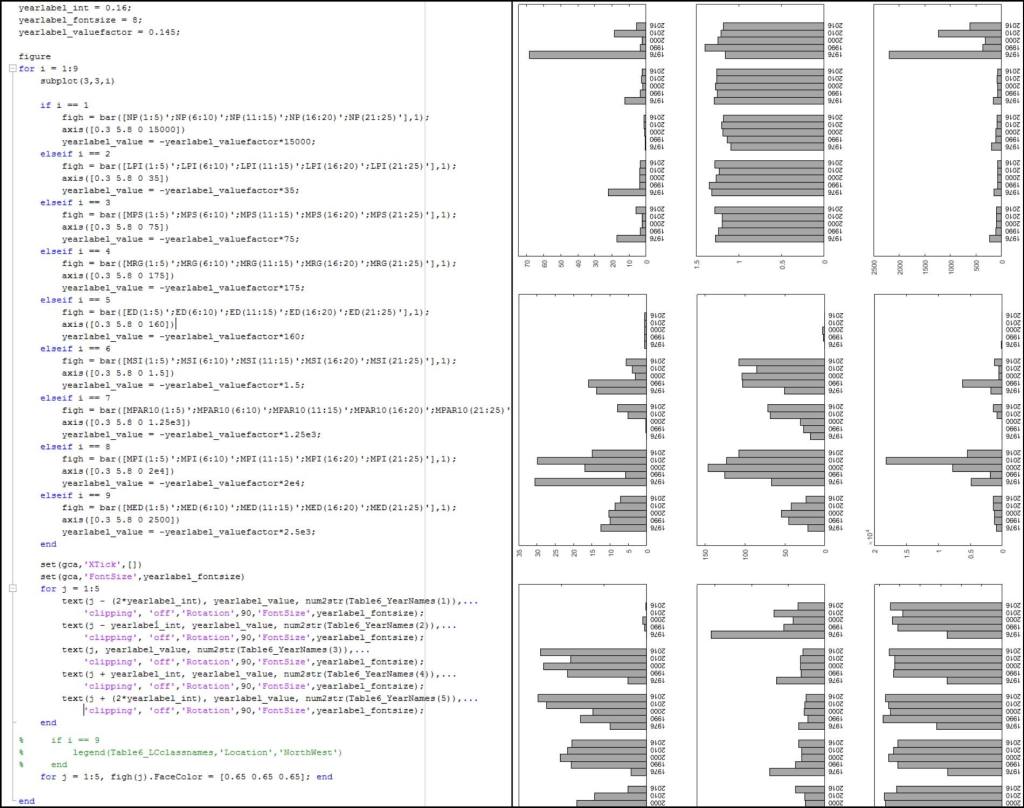
As an example, recently I was working on a paper with a colleague (published here), where we were initially representing some numbers in a huge table. After some further discussion, we decided to represent them in the form of grouped bar plots. Even though this involved many hours of discussion, planning the design, and effort, the final version of the grouped bar plots really enhanced the usability of the information, and also the visual representation of the inter-relationships within the various data parameters.

A simple looking set of grouped bar plots sometimes requires many lines of code and many hours of work.

Synthetic Aperture RADAR (SAR) Remote Sensing Basics and Applications – Part 2

A very good curated list of SAR data sources and processing softwares.

GeoSpatial WareHouse

Software, Tools, Libraries, Utilities etc.  Detail
SAR data processing
Polarimetric and polarimetric interferometric SAR (PolSAR / PolInSAR)
  • PolSARPro – The ESA Polarimetric SAR Data Processing and Educational Tool
Interferometric synthetic aperture radar (InSAR)
  • GMT5SAR – InSAR processing system based on GMT. (for developers)
  • ISCE – InSAR Scientific Computing Environment.
  • Doris – Delft object-oriented radar interferomtric software.
  • Gamma – Gamma Remote Sensing SAR and Interferometry Software.
Multitemporal/time series InSAR analysis
  • GIAnT – Generic InSAR Analysis Toolbox.
  • MintPy – Miami INsar Time-series software in PYthon.
  • PyRate – A Python tool for Rate and Time-series Estimation
  • SARPROZ – The SAR PROcessing tool by periZ
  • StaMPS/MTI – Stanford Method for Persistent Scatterers – git-version
Performing Tropospheric Noise…

View original post 393 more words

Synthetic Aperture RADAR (SAR) Remote Sensing Basics and Applications

GeoSpatial WareHouse

This post will provide an overview of the basics of Synthetic Aperture RADAR (SAR) and applications. The main topics discussed in the listed documents include: SAR basics, backscatter, geometry, interferometry, polarimetry, SAR data, data acquisition, available data sets/access to data, data analysis tools, future missions and SAR applications. Please do check Part 2 for more details.

What is RADAR? – RAdio Detection And Ranging

What is SAR? – Synthetic Aperture Radar – Synthetic Aperture Radar (SAR) is an active remote sensing technology that uses microwave energy to illuminate the surface. The system records the elapsed timeand energy of the return pulse received by the antenna (PDF).

Image result for SAR satellite systems (source: unavco)

Synthetic Aperature Radar (SAR) Tutorials

  1. A Tutorial on Synthetic Aperture RADAR – ESA (PDF )  (PDF) (Radiometric Calibration of SAR Image)
  2. The Canada Centre for Mapping and Earth Observation (CCMEO) is considered…

View original post 1,329 more words

Forest Fires in Pakistan – A Geospatial Analysis

We cannot underrate the significance of forests in our life. We rely on the forests for living, from the air we breathe to the wood we exploit. Apart from providing food and shelter to animals and livelihoods to people, forests are playing major role in tempering climate change and help in preventing soil erosion as well. Yet, regardless of forests requirement for survival, we are still permitting them to die out. Forest fires are among the main factors causing huge damage to forest ecosystem and in larger context climate change.

Forest fire occurs when the forest burns either naturally or by anthropogenic activity which brings loss of organic matter, deforestation and greenhouse gases emissions, mainly carbon dioxide and methane. Natural forest fire includes an unplanned burning of forest due to lighting mostly in dry season. Human-induced forest fire results due to carelessness of people when they leave burning woods after cooking, cigarettes or an unauthorized burning practices e.g. shifting cultivation, fuelwood collection.

According to media, In June 2019, around 1.22 million trees have been burned down in different forest divisions of Khyber Pakhtunkhwa province soon after Eid-ul-Fitr in which most of the burnt trees were planted under the Billion Tree Tsunami campaign by the government in the last two years. There could be multiple reasons of these fires but it’s a matter of serious concern how can fires erupt at once over so many locations.

Over 100,000 trees burnt down in Khyber Pakhtunkhwa wildfires: officials

Therefore, a small study is carried out to remotely detect and measure the fire affected areas with the generation of burn severity map for the assessment of affected areas. Satellite imagery of Sentinel 2A were used in Google Earth Engine (GEE), a total of seven images of each (pre-fire and post-fire) of months May and June 2019 respectively were mosaiced to cover the whole forest fire effected area. The Normalized Burn Ratio (NBR) index was applied over the pre and post fire images. To assess and map the forest fire burn severity, post-fire NBR was subtracted from the pre-fire NBR to create the differences (or delta) NBR (dNBR) image. The dNBR values were classified according to burn severity ranges proposed by the United States Geological Survey (USGS) from which only four burn severity classes (High, Moderate-high, Moderate-low and Low) were implemented in this study.

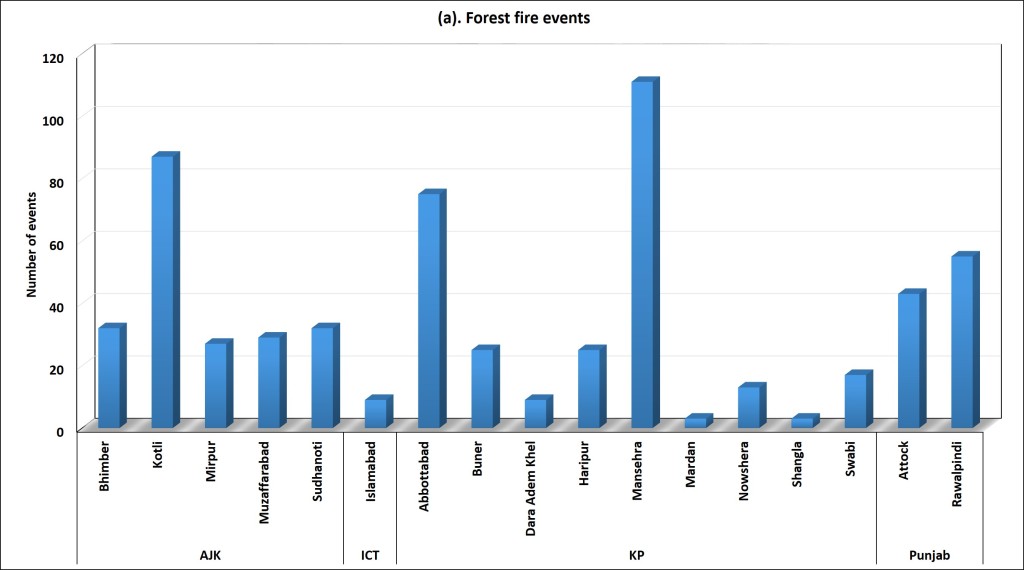
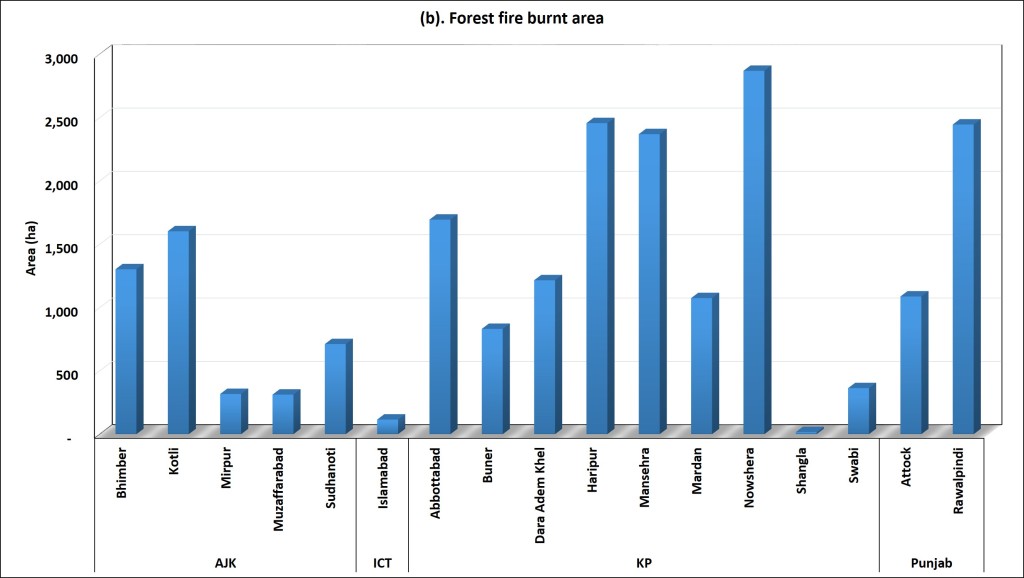
Initially by visual interpretation of temporal Sentinel-2A satellite imagery, it was surprising to know that not only the districts of Khyber Pakhtunkhwa (KP) but also the several districts of Azad Jammu and Kashmir (AJK) and Punjab as well as several locations in Islamabad Capital Territory (ICT) were part of these blazes. In 16 districts and ICT, a total of 595 forest fire events (Figure 1a) at smaller scale to very large area extent were recognized with total 20,778 hectares (ha) area effected (Figure 1b).

Figure 1: Based on June 2019 Sentinel-2A satellite images, an assessment of (a) Forest fire events and (b) Burnt area quantification in affected regions of AJK, ICT, KP and Punjab

Less than 10 forest fire events were observed in ICT and Dara Adam Khel, Mardan and Shangla districts of KP while more than 70 forest fire events were recorded in Kotli district of AJK, Abbottabad and Mansehra districts of KP. Mirpur, Muzaffarabad, Islamabad, Shangla and Swabi are among the least fire affected areas with burnt area below 400 ha. The Kotli district in AJK is the most affected with number of fire events up to 87 and 1,602 ha burnt area. Overall, Rawalpindi and other districts of KP including Haripur, Mansehra and Nowshera exhibit dramatically more than 2,000 ha forest burnt.

Out of total 20,761 ha forest fire affected areas of all districts, 14,529 ha were detected under Low burn severity while 5,359 ha and 7,72 ha area is recognized with Moderate-low to Moderate-high forest fire severity, respectively, only 101 ha area observed under High burn severity.

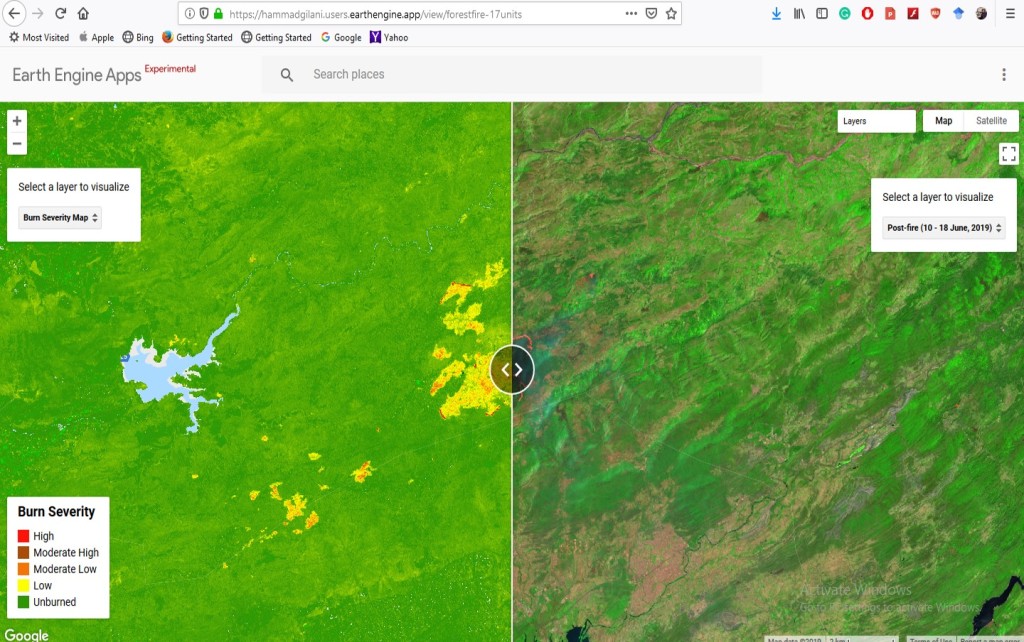
A screenshot of the developed web application for dynamic visualisation in Google Earth Engine is shown below in Fig. 2. The dynamic interactive application can be accessed here.

Figure 2: Screenshot of the Google Earth Engine visualisation web application and swiping features. To interact with the dynamic visualisation, click on the image or go to this link.

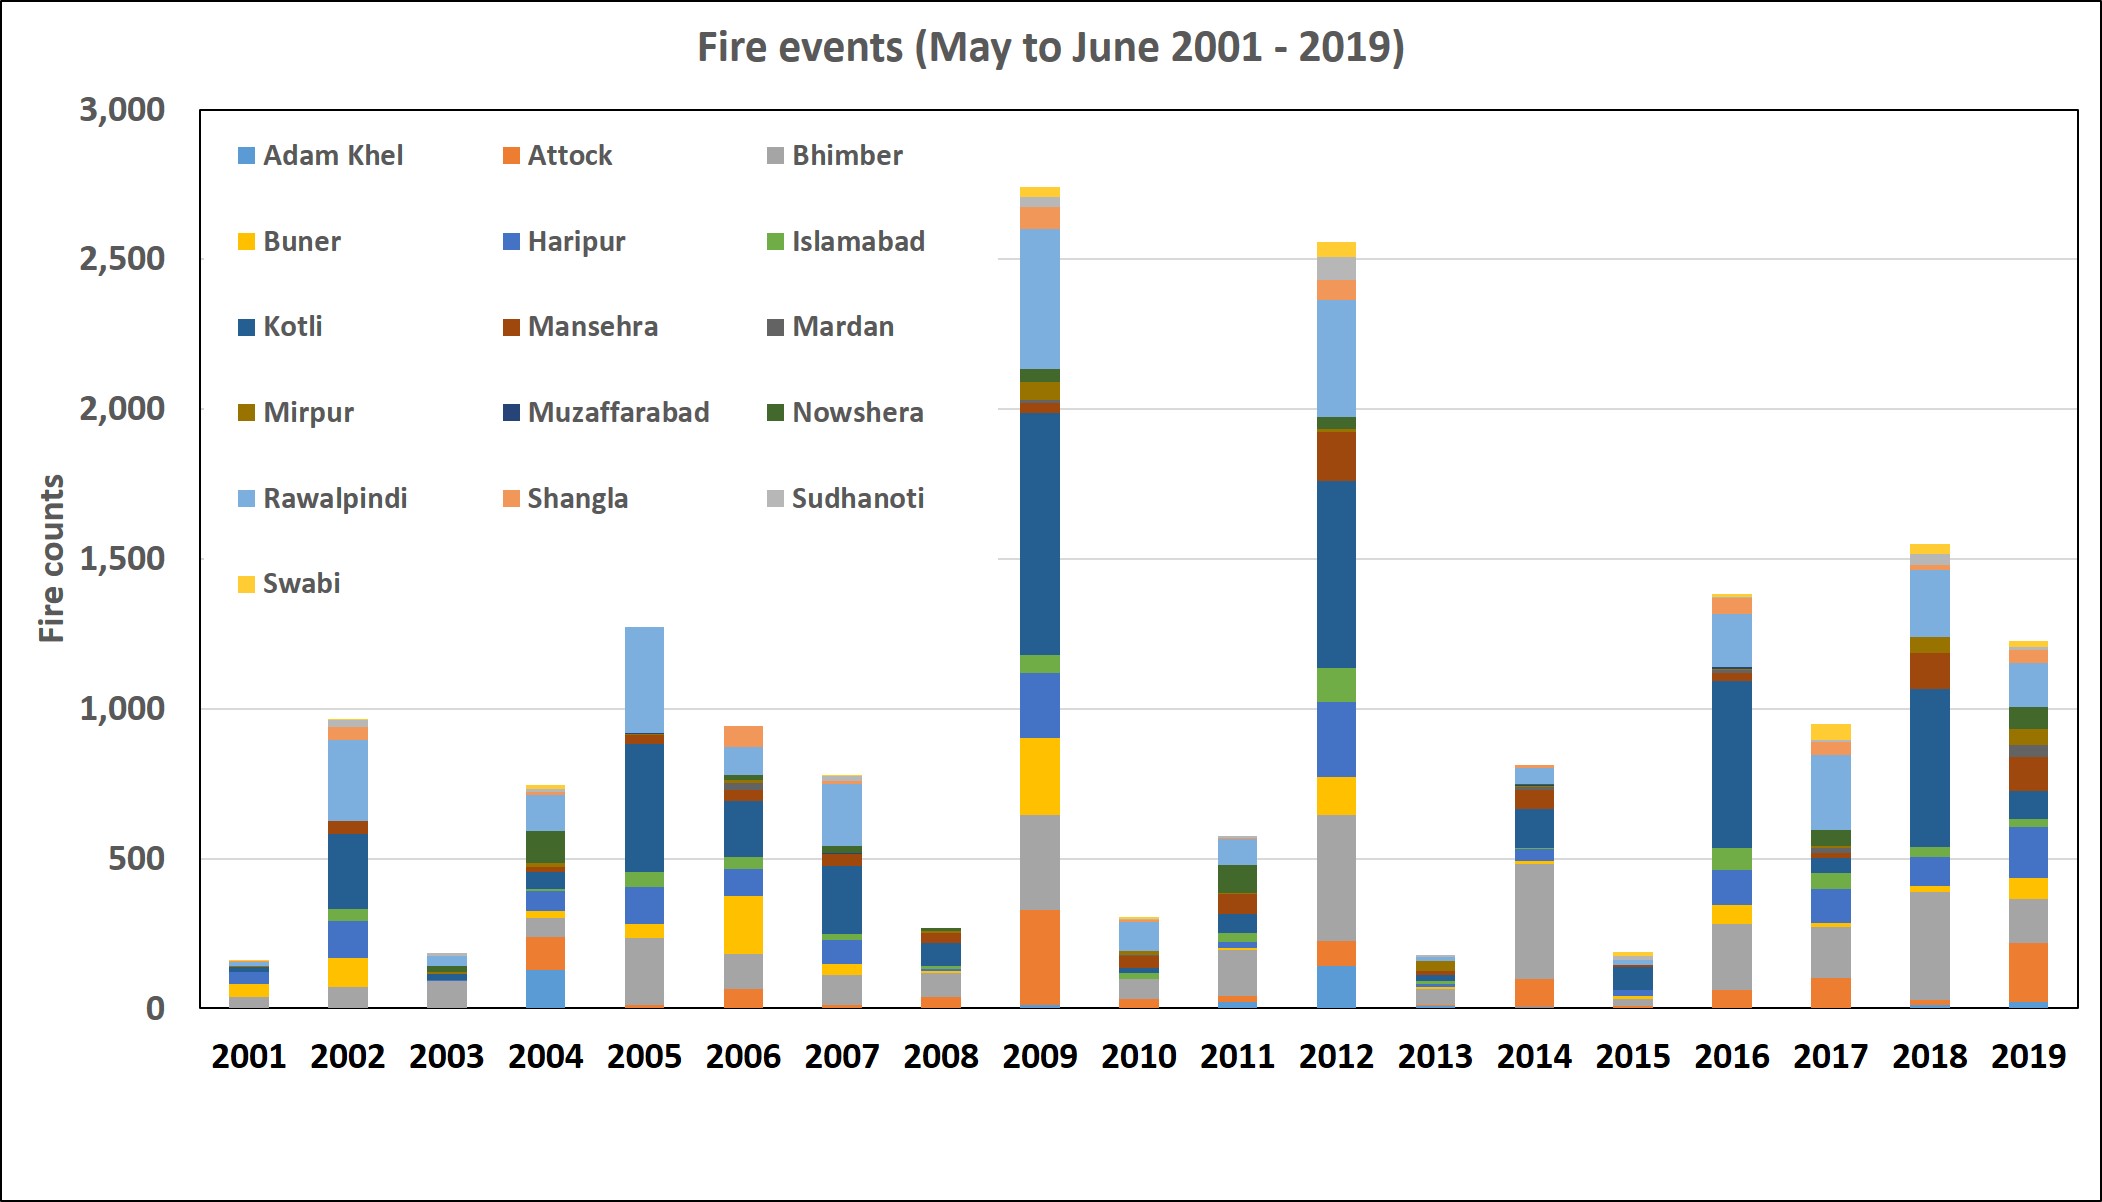
Based on temporal assessment (May-June 2001 – 2019) of the MODIS/VIIRS Fire Information for Resource Management System (FIRMS) daily product, we have observed total 17,879 fire incidents in 17 administrative units (Figure 3). Although government, civil societies and individuals are planting more and more trees but conservation of existing trees should be our core and primary responsibility. Based on in-situ and geospatial datasets, a comprehensive study needs to be conducted for better understanding, to take forest fire precaution measurements, and for effective implementation of developed forest conservation policies and practices.

Figure 3: Counting of fire incidents between May-June 2001-2019, based on FIRMs satellite product.

About this post: This is a guest post by Hammad Gilani and Awais Ahmad

Acknowledgement: The Geospatial Research and Education Lab (GREL) at Institute of Space Technology (IST), Islamabad, Pakistan.

Conflicts of Interest: The findings reported stand as scientific study and observations of the author and do not necessarily reflect as the views of author’s organizations.